
 4474
4474
Audience: Volunteer Intake Coordinator, Client Intake Coordinator, Event Manager
Introduction
The Engage reports offer real-time reports and analytics and are highly customizable. The reports list records that you can display in rows and columns, and can be filtered, grouped, or displayed in a graphical chart. Users with access to the Engage reports also have the ability to save their customized reports in a folder that can be shared with others. This guide covers the steps on how to generate and customize a report in Engage.
Table of Contents:
- Who can view these reports?
- What Engage Reports are available?
- How to get to the Engage Reports?
- How to filter your report?
_____________________________________________________________________________________
Who can access the Engage Reports?
Only volunteers with the following administrative positions are able to access the Engage Reports:
- Volunteer Intake Coordinator
- Client Intake Coordinator
- Event Manager
- SCORE Workshop Presenter
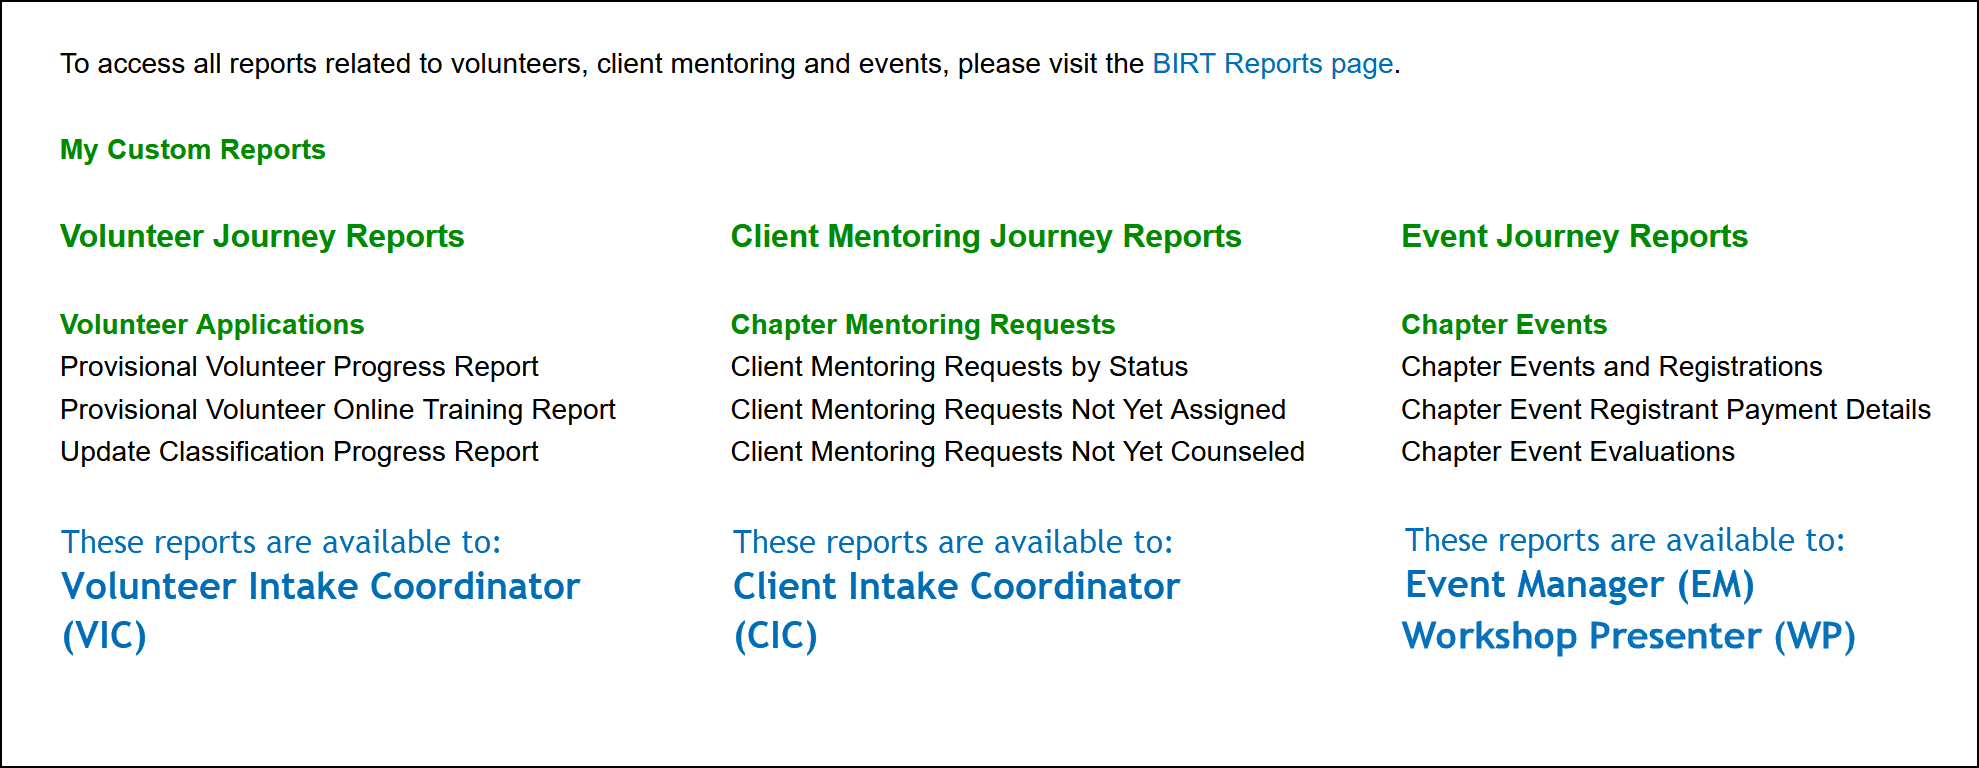
What Engage Reports are available?
View the image below to determine which reports are available to your admins (VIC, CIC, EM).

How to access these Engage Reports?
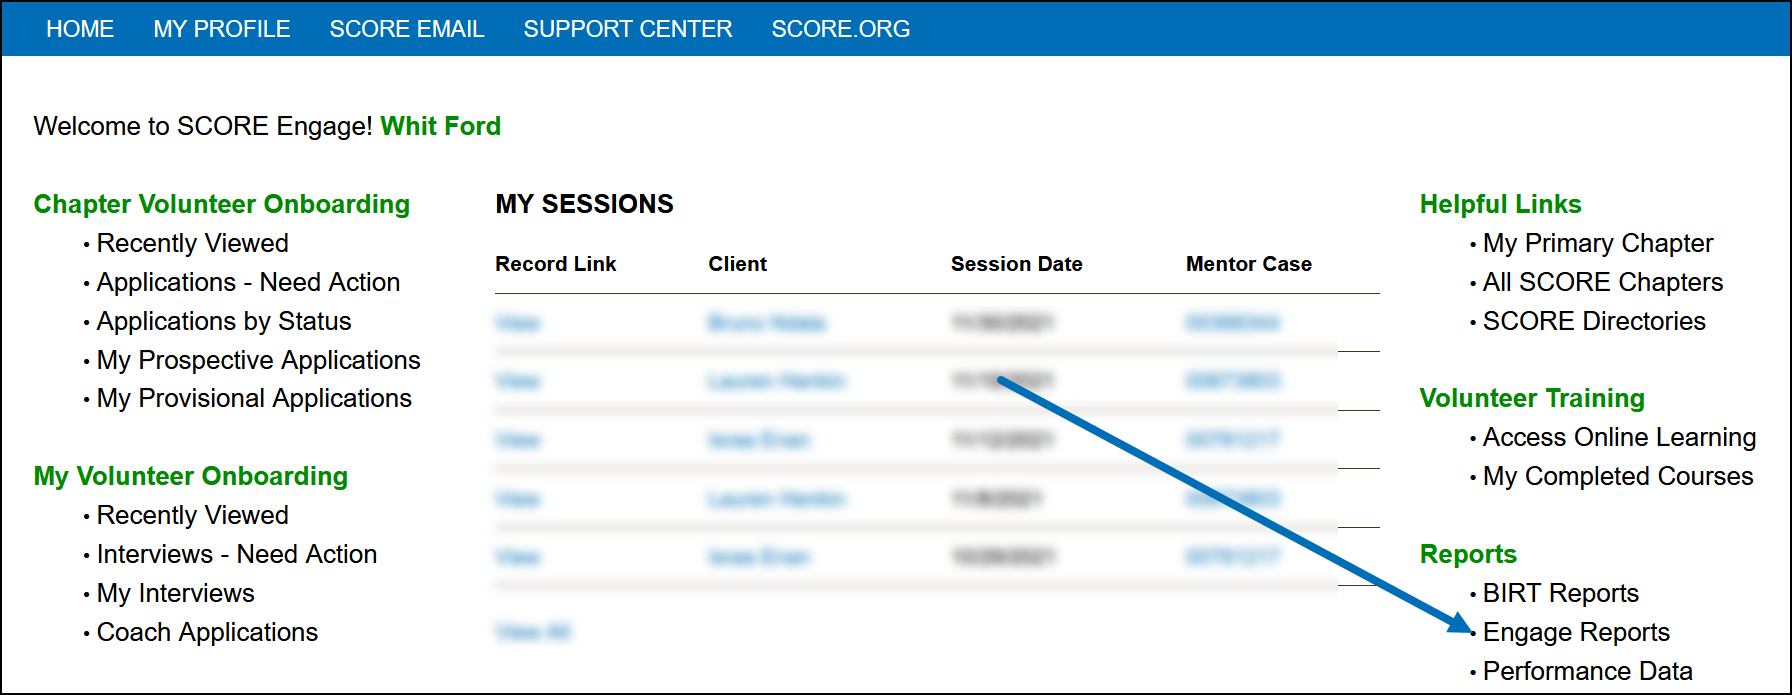
1) From the Engage home page, select Engage Reports under Reports.
2) Click the Engage report you want to run.
Note: Engage reports are only available to you according to your position e.g. VIC, CIC, EM and WP.
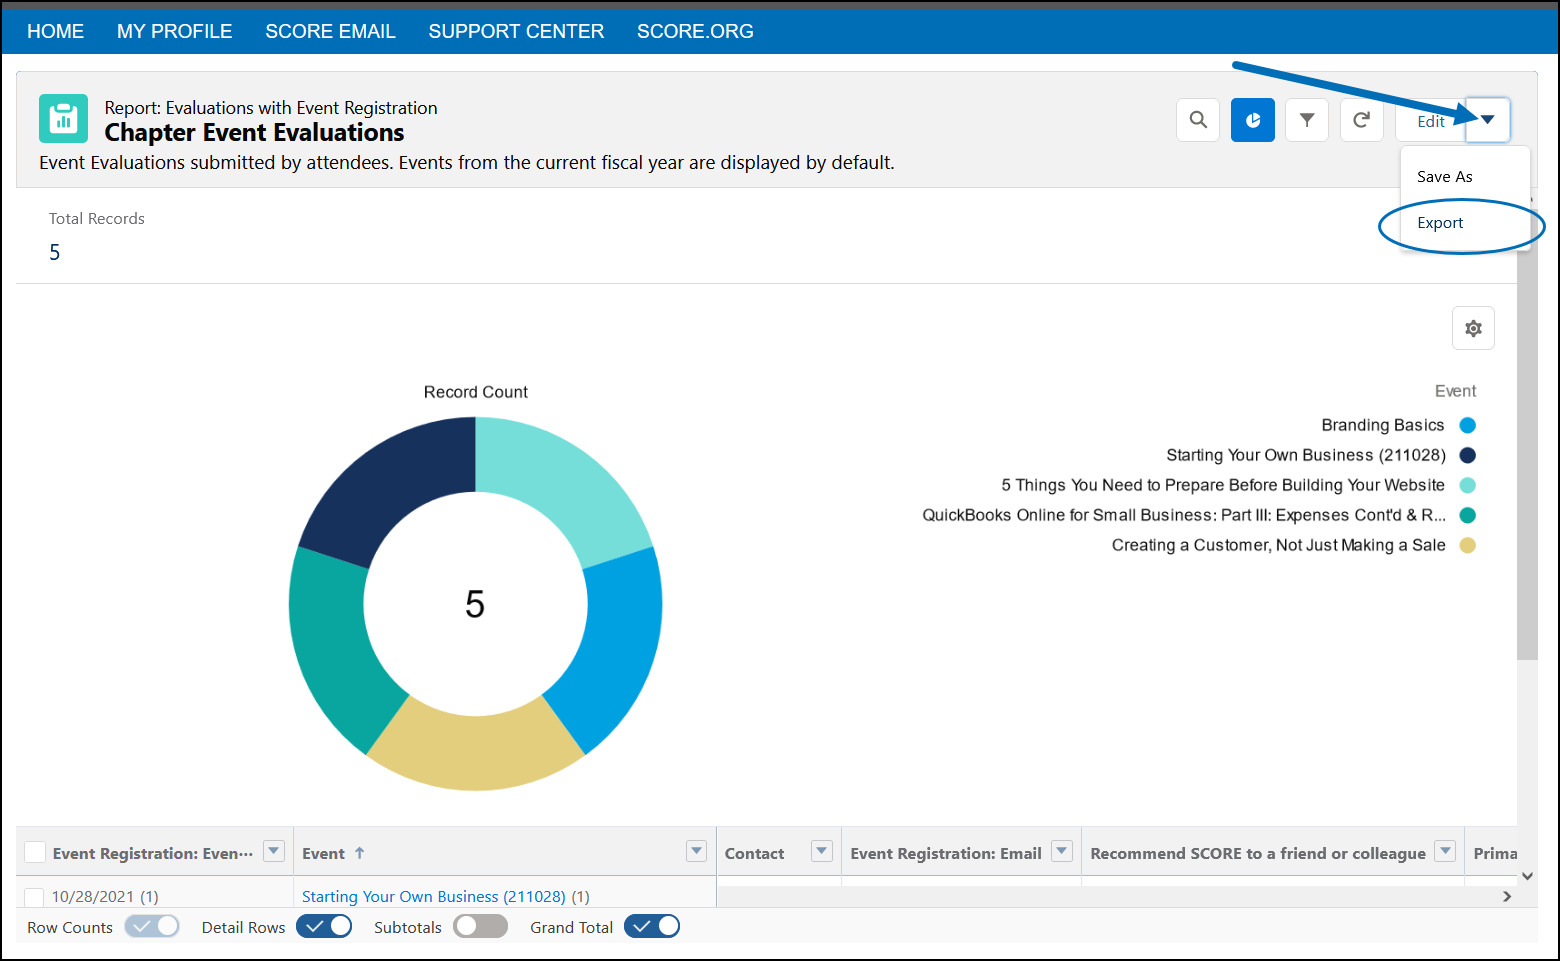
3) To print the report, click the drop down ![]() and select Export.
and select Export.
Note: Event reports have charts that you can toggle off and on.
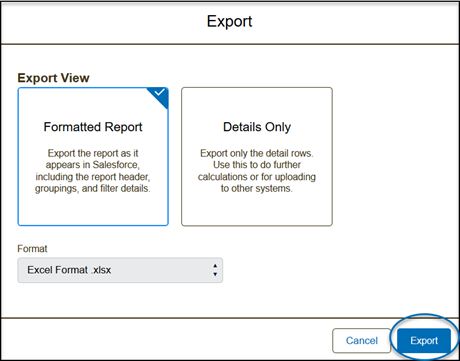
4) Then, select your preferred format, then click Export. The report will then be downloaded to your local device. Open it to view and/or print as you would any other spreadsheet.
How to filter an Engage Report?
- Refine your reports to focus precisely on the data you need. Click the funnel icon to access and set your FILTER criteria.
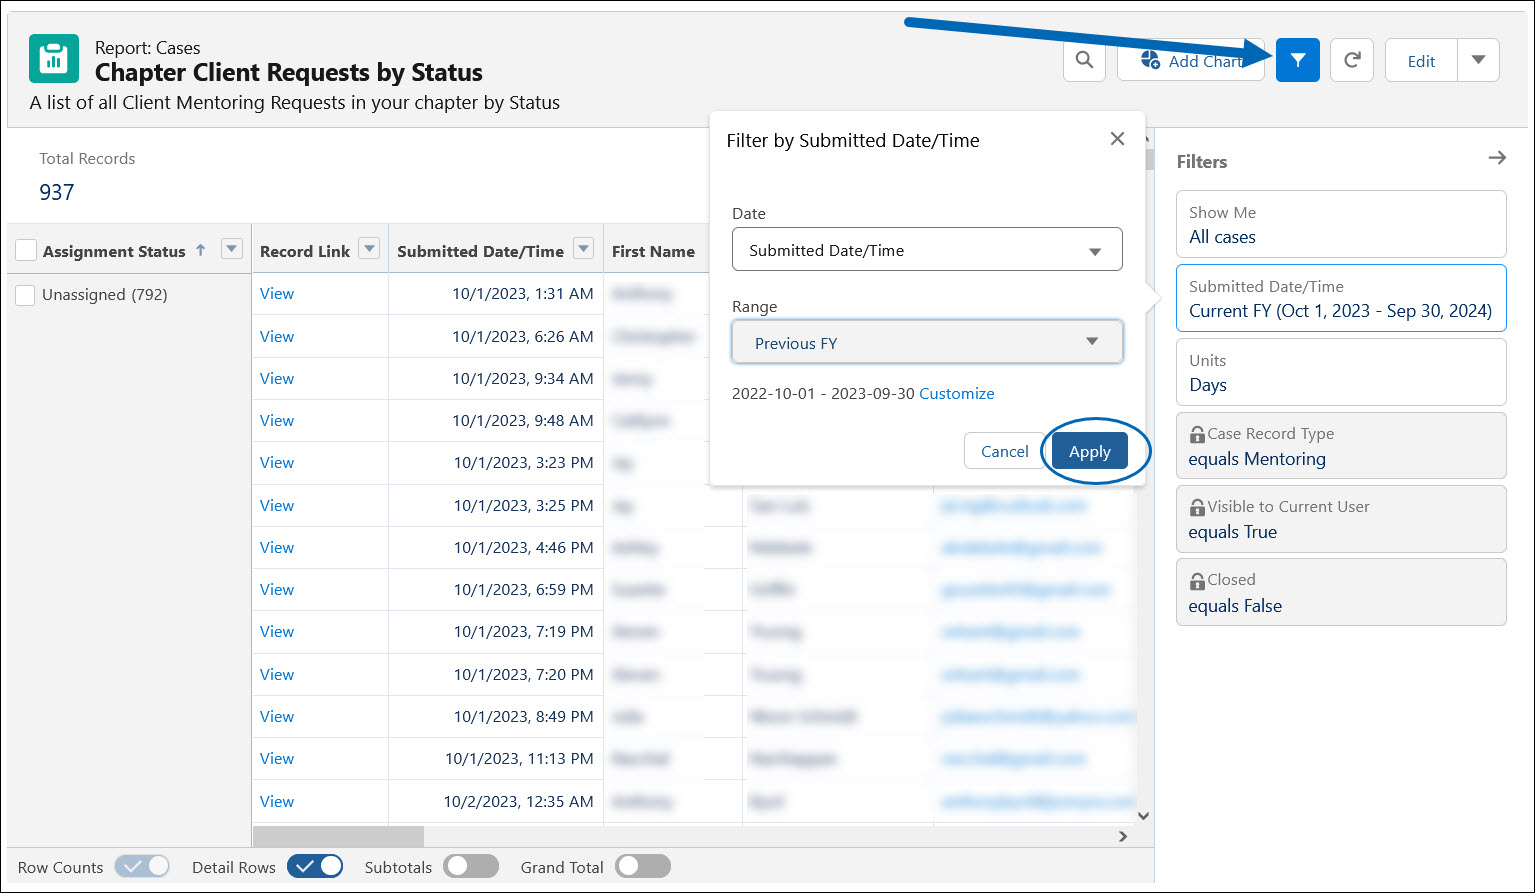
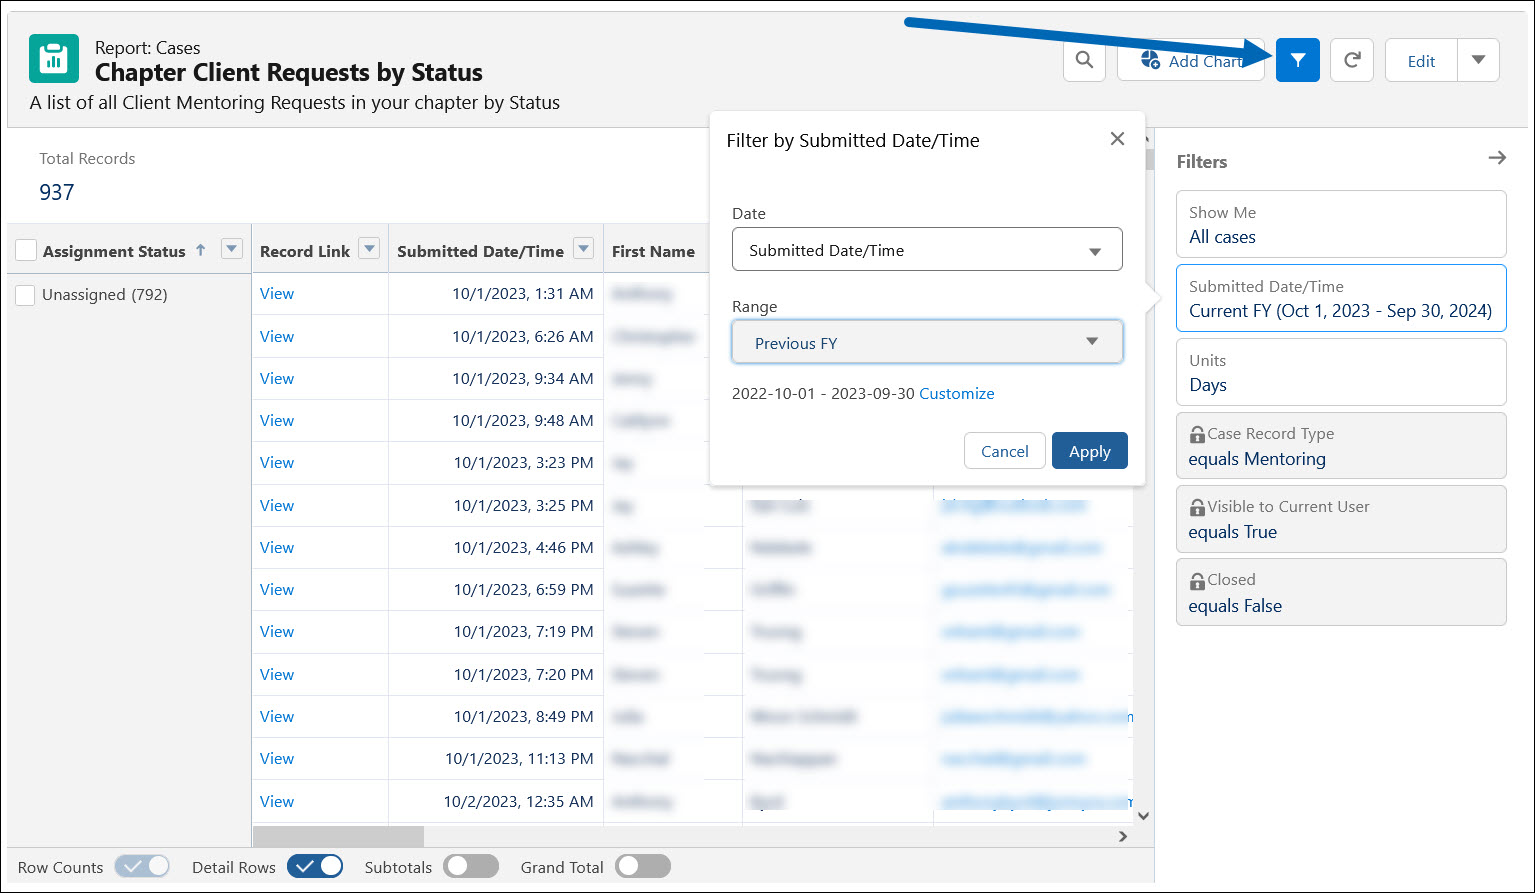 Sample image: Chapter Client Requests by Status report is filtered by Submitted Date/Time and Range as Previous FY.
 -
Click Apply to generate your report based on the selected filters.
Relevant Resources:

